

The Weekly Update 1/10/2025
The Number One Driver of Our Economy
As you know from reading our monthly update, The Seven Signs of a Changing Economy™, Sign #1, is Personal Consumption Expenditures (PCE). Per J.P. Morgan PCE represents 67.8% of our entire U.S. Economy. So, if you reviewed nothing but PCE each month you could be highly confident of the economic backdrop Corporate America must operate in, i.e., growing or contracting!
Peel back the economic onion skin and you see a few key inputs that would indicate how much inertia is behind the current up trend. The first chart below from scottgrannis.blogspot.com measures the U.S. household net worth back to 1952.

If you did the arithmetic, you would note that private sector net worth increased +12,652% since 1952. Never ever higher than Now. A solid positive indication for continuing PCE growth.
This second chart is the breakdown of that net worth for the U.S. private sector. As you observe this chart make a mental note of that purple bar pushing $170 trillion. Also notice the debt level has increased only a smidge in comparison.
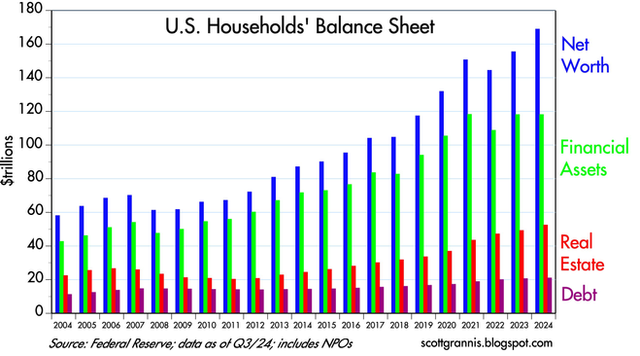
You are looking at Rocket fuel for the consumer spending going forward.
In this last chart it is surprising to see the household liabilities as a percentage of assets, is about the same as the mid 1960’s i.e., not much.
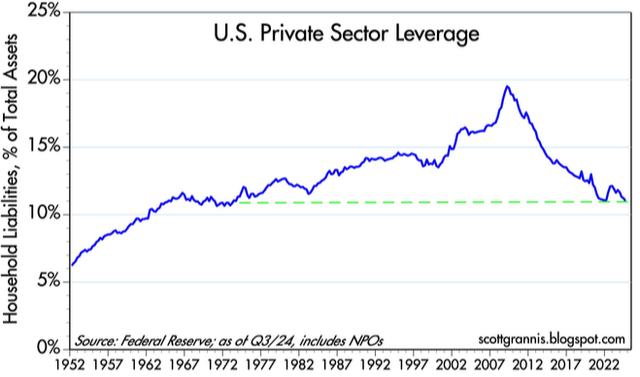
Again, strong economic inertia pushing forward. Yet, per the recent Fear & Greed Index, Mr. & Mrs. 401(K) are so fearful they can’t even spit!
Check it out.
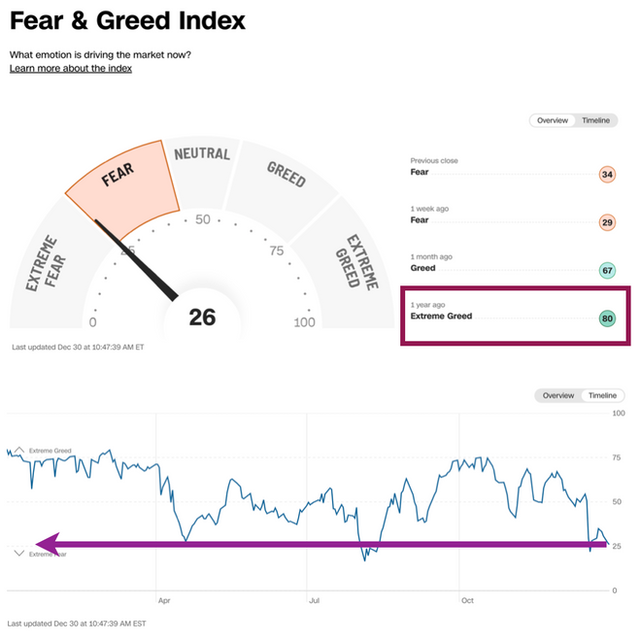
Really! 26!!
Take a moment to observe the red box on the right. One year ago, at this time this index rested at 80, which suggests “Extreme Greed”. As we left December 2024 the S&P 500 is up about +23% versus a year ago, and we rest at 26!
Let your eyes look backward right to left and observe, via the purple arrow, we ended 2024 at nearly the most fearful level for all of 2024. The August 2024 sell-off that lasted a whopping two weeks was the only period that was more fearful.
The consumer is solid and has plenty of money to keep the momentum, upward trend, going.
In my opinion, the trend in market valuations of Corporate America should also continue to trend upward.
I did not say market valuations go straight up, and I did not say without volatility, yet the data flow suggests the good old USA is still waking up from the post Covid hangover.
I am interested in your thoughts, comments, and observations. Feel welcome to call, email, or stop by the office and say Hi.
Respectfully,
James O. Lunney, CFP®
CERTIFIED FINANCIAL PLANNER™ Professional
Securities and advisory services offered through LPL Financial, a registered investment advisor. Member FINRA/SIPC. The opinions voiced in this material are for general information only and are not intended to provide specific advice or recommendations for any individual Investing involves risks including possible loss of principal. No investment strategy or risk management technique can guarantee return or eliminate risk in all market environments.
The opinions voiced in this material are for general information only and are not intended to provide specific advice or recommendations for any individual. All performance referenced is historical and is no guarantee of future results. All indices are unmanaged and may not be invested into directly.
Investing involves risk including loss of principal. No strategy assures success or protects against loss.
The economic forecasts set forth in this material may not develop as predicted and there can be no guarantee that strategies promoted will be successful.
The S&P 500 Index is a capitalization-weighted index of 500 stocks designed to measure performance of the broad domestic economy through changes in the aggregate market value of 500 stocks representing all major industries.