

The Weekly Update 11/15/2024
Comparing Notes to 11/17/2023 “Rocket Fuel”
In The Weekly Update dated 11/17/2023, pasted in below, I asked you to “print it and put it in your file to look at one year from today”.
At the time Sign #2, Money Flow, was so positive it was suggesting the possibility of strong gains ahead. When that edition of The Weekly Update hit your email the valuation of Corporate America, as measured by the S&P 500, was 4,514.02.
Today, as I write this update, 11/13/2024, the S&P 500 rests at 5,983.99, up +32.56% for the twelve months. Note to self, +32.56% is double the average since 1952 in the second bullet point below.
This update is not to brag or pat myself on the back, but instead to share how powerful these fact-based and source-cited signs of change are: Sign #2 can be your x-ray glasses to see right through the bologna and noise in our news sources to the flow of money, which tends to flow where it will be treated best.
Here is the entire edition of The Weekly Update I wrote and posted to TWSG website on 11/17/2023.
“Rocket Fuel”
Today you will receive an email from The Wealth Strategies Group with the monthly update for The Seven Signs of a Changing Economy™.
Sign #2, Money Flow is so good that I have reprinted it here as The Weekly Update. I suggest you print this and put it in your file to look at one year from today. Then next year on November 17, 2024, post Presidential election, let’s compare notes!
(Positive) [Reduced from positive to neutral in June 2022, from neutral to negative in July 2022, back up to neutral from negative in June 2023 and up again to positive in July 2023]
Sign #2 is our Money Flow weathervane. This sign is used to measure which way the investment money is flowing, i.e., into, or out of, specific parts of the capital markets. It is also used to measure how much money is flowing. Before I get to those stats, let’s observe a few other historically accurate data flow points.
- Since 1950, the six-month period of November through April are the best performing six months of the year at +7% on average (Source: Bloomberg 11/3/2023).
- In just six weeks we start a Presidential election year. In the years where the President is running for re-election, market performance has been excellent. (I expect Biden to run despite ongoing speculation to the contrary). There have been 15 of these election years since 1952 and the average S&P 500 return has been +15%!
- It is my opinion that the Federal Reserve is done increasing interest rates to fight inflation, which you will read below in Sign #7, is dropping like a rock. Even if the Fed hikes one more time it would likely be assumed to be the last one and the markets would do well, i.e., it doesn’t matter.
As for Money Flow, well Mr. and Mrs. 401(k) continued to sell a record amount of mutual funds holding the ownership of Corporate America with sells of $44.12 billion between 10/4/2023 – 11/2/2023, making the annual outflow YTD $168.99 billion! (Source: ICI, Investment Company Institutional, November 8, 2023)
In addition, hedge funds and aggressive trades have the third largest “sold” short position in history!
As you observe the chart below read the three bullet points above one more time out loud! Then, ask yourself what happened after the prior three red star lows before this one!
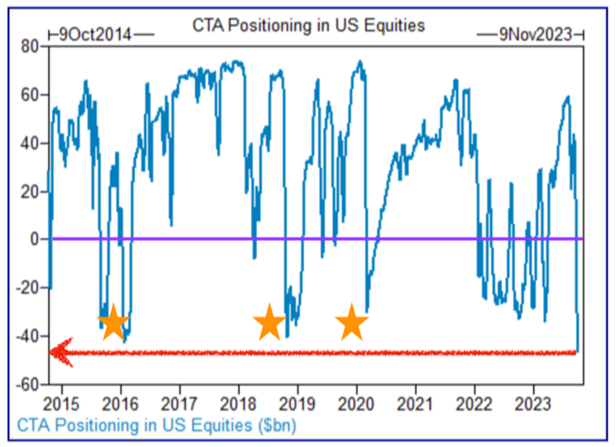
You are reading and looking at “Rocket Fuel” to the upside.
Sign #2 is so positive I can hardly believe it.
In the November 2024 edition of The Seven Signs of a Changing Eonomy™, under sign #2 (Money Flow), the positive Money Flow into Corporate American remains strong. (Read it Here)
I’m interested in your thoughts, comments, and observations. Feel welcome to call, email, or stop by the office and say Hi.
Respectfully,
James O. Lunney, CFP®
CERTIFIED FINANCIAL PLANNER™ Professional
Securities and advisory services offered through LPL Financial, a registered investment advisor. Member FINRA/SIPC. The opinions voiced in this material are for general information only and are not intended to provide specific advice or recommendations for any individual Investing involves risks including possible loss of principal. No investment strategy or risk management technique can guarantee return or eliminate risk in all market environments.
The opinions voiced in this material are for general information only and are not intended to provide specific advice or recommendations for any individual. All performance referenced is historical and is no guarantee of future results. All indices are unmanaged and may not be invested into directly.
Investing involves risk including loss of principal. No strategy assures success or protects against loss.
The economic forecasts set forth in this material may not develop as predicted and there can be no guarantee that strategies promoted will be successful.
The S&P 500 Index is a capitalization-weighted index of 500 stocks designed to measure performance of the broad domestic economy through changes in the aggregate market value of 500 stocks representing all major industries.