

The Weekly Update 12/06/2024
As we left the Third quarter of 2024 (3Q2024), the earnings (profits) of Corporate America got so good and so far ahead of the negative slowdown predictions that the business media quitely stopped reporting on it. Remember, good news does not keep your eyeballs glued to their screen long enough to sell you their “stuff”, so instead they pull out the next scary monster. LOL!
Below is a chart of the now complete 3Q2024 earnings. Wow! up over 8% year over year. Note to self, just 90 days ago the “experts” were predicting less than 3% growth.
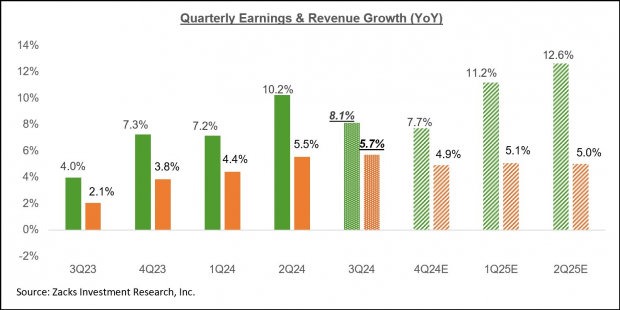
As you observe this chart let your eyes drift from left to right and notice that nearly +25% growth rate for the first half of 2025!
As of 12/04/2024 Yardeni Research has the 2025 forward earnings per share for Corporate America at $290.99.
This is valuable intelligence as we can use it to peek around the corner to see what that means to our Fair Market Value (FMV) Estimate for 2025. To get this peek around the corner, we like to use the Business School Rule of Thumb, “The Rule of 20”.
To use “The Rule of 20” you just subtract the inflation rate from 20. I will use the same inflation rate the BEA used in calculating the Gross Domestic Product (GDP) for the 3Q2024 “Second Estimate”, released on November 27, 2024, of +1.90% and 2025 earnings per share estimate of $290.99 to calculate the Fair Market Value (FMV).
- 20 – 1.90 = 18.10
- 2024 S&P 500 earnings estimate $290.99 (Source: Yardeni Research, 12/04/2024)
- 2025 S&P 500 Fair Market Value estimate $299.99 x 18.10 = S&P 500 FMV 5,429.82
- As of 12/31/2024, the S&P 500 trades at 6,086.49, about a +12.09% premium to 2025 FMV.
Clearly the 12.09% premium to FMV is high! However, let’s get more real.
The current price of the S&P 500 at 6,086.49 divided by the earnings of $299.99 is 20.29x. This is a Price to Earnings Ratio (P/E Ratio) and is a widely accepted measure of risk. Higher P/E = Higher risk.
Per J.P. Morgan Guide to the Markets (9/30/2024) the 20-year average P/E ratio for the S&P 500 is 19.2x. So close! “But”, back out those big six tech companies and the P/E drops to a historically reasonable 14x.
Take a moment and take another look at the chart above one more time. As you do, take special note of the increasing earnings versus flat revenue. That of course is due to the productivity gains from technology and Artificial Intelligence (A.I.) gaining traction.
Use this as a reminder that “Expensive” and “Over Valued” are two very different things. Based on the above arithmetic it would be safe to say the markets might appear expensive but not over valued based on earnings and earnings growth. As detailed in last week’s edition of The Weekly Update 11/29/2024 (Read it Here), earnings and earnings growth going forward are the key inputs that make your Kool-Aid stand more valuable than mine.
Speed bumps, roadblocks, and potholes ahead? Yes, that is likely.
Again, I did not say market valuations go straight up, and I did not say without volatility, yet the fact based, and source cited data inputs, like this one, suggest the valuation trend upward will remain intact as we cross into 2025.
Any air pockets that might happen will keep TWSG team continuing to manage risk and add strategic investments to our client family’s asset allocations.
I am interested in your thoughts, comments, and observations. Feel welcome to call, email, or stop by the office and say Hi.
Respectfully,
James O. Lunney, CFP®
CERTIFIED FINANCIAL PLANNER™ Professional
Investing involves risks including possible loss of principal. No investment strategy or risk management technique can guarantee return or eliminate risk in all market environments.
The opinions voiced in this material are for general information only and are not intended to provide specific advice or recommendations for any individual. All performance referenced is historical and is no guarantee of future results. All indices are unmanaged and may not be invested into directly.
Investing involves risk including loss of principal. No strategy assures success or protects against loss.
The economic forecasts set forth in this material may not develop as predicted and there can be no guarantee that strategies promoted will be successful.
The S&P 500 Index is a capitalization-weighted index of 500 stocks designed to measure performance of the broad domestic economy through changes in the aggregate market value of 500 stocks representing all major industries.