

The Weekly Update 2/28/2025
“Sideways is SCARY”!
The first chart below is a price chart for the values of Corporate America as measured by the S&P 500 Dividend Index from late 2023 until now.
As you observe this chart note: A) The purple arrow is going back in time to about August of 2024. Note the values of Corporate America are about the same now as they were six months ago. We call this base camp. It is where values rest before the next leg up the Bigger Financial Future Mountain.
Note too, Item B) The red dotted box. I like to use these boxes that capture the high and low prices over a period of time. Why? In my opinion these help us visualize where the likely bottom of valuations rest and the level above that we must break through to leave this base camp.
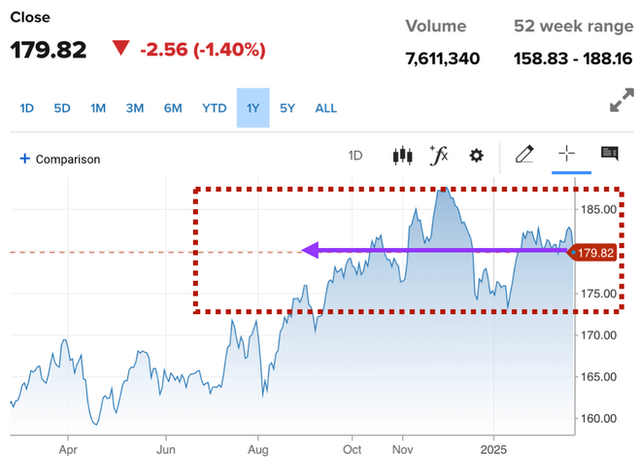
For the last six months, generally speaking, only two things changed. A) Market valuations took a rest from going up over the last two years and B) the President changed. In the chart below we are now at “extreme fear” per the Fear vs. Greed Index on February 27, 2025.

As your eyes drift to the bottom of the chart, notice the blue dot above last October which represents “Extreme Greed” versus the red dot at “Extreme Fear” today.
Mr. and Mrs. 401(K) are now as scared as they were 20 months ago and also at the same level as the October 2022 lows…. Just FYI, that was 15,000 Dow Jones points below NOW.
Does this seem logical or reasonable? Not to me! History has proven time and time again that sideways markets don’t last, but they are nerve wracking and Presidents, well they come and go.
What does matter? The earnings of Corporate America, and they are coming in at the highest levels and highest growth rate levels, EVER!
Remember, it is rare, as in I have never seen it in my 43 years, that market values go sideways and then just drop. Instead, they almost always go sideways and then finish above the red dot box level we observed in Chart #1 above.
I believe we breakout of the Red Box to the upside and that it happens by summer!
I am interested in your thoughts, comments, and observations. Feel welcome to call, email, or stop by the office and say Hi.
Respectfully,
James O. Lunney, CFP®
CERTIFIED FINANCIAL PLANNER™ Professional
Securities and advisory services offered through LPL Financial, a registered investment advisor. Member FINRA/SIPC. The opinions voiced in this material are for general information only and are not intended to provide specific advice or recommendations for any individual Investing involves risks including possible loss of principal. No investment strategy or risk management technique can guarantee return or eliminate risk in all market environments.
The opinions voiced in this material are for general information only and are not intended to provide specific advice or recommendations for any individual. All performance referenced is historical and is no guarantee of future results. All indices are unmanaged and may not be invested into directly.
Investing involves risk including loss of principal. No strategy assures success or protects against loss.
The economic forecasts set forth in this material may not develop as predicted and there can be no guarantee that strategies promoted will be successful.
The S&P 500 Index is a capitalization-weighted index of 500 stocks designed to measure performance of the broad domestic economy through changes in the aggregate market value of 500 stocks representing all major industries.